

Commissioned Analysis
DiscoveryM
Features
Multi-component Spectra Can Be Searched Directly.
Spectral matching can be achieved based on spectral similarity without being affected by the fluctuations in retention time or peak intensity. Even if the spectra are obtained by different operators, they can be interpreted objectively with the same criteria.
Quick Analysis with No Need of Separation
You can build your own library with the mass spectral data you have accumulated. Moreover, you can easily predict the constituents of a sample even without a separation step such as liquid chromatography.
Unknown Peaks Can Be Interpreted
When an unexpected m/z peak is detected, you can immediately find the reason — whether it is a contamination from a previous experiment, a background noise or the sample’s component.
What Makes the DiscoveryM So Different from Other Products?
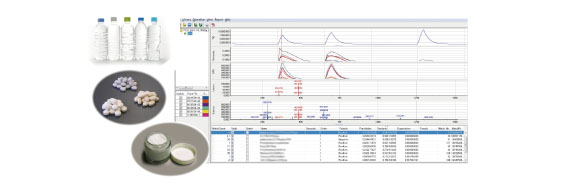
A complicated mass spectrum of a mixture can be directly subjected to a database search, and its variable constituents can be identified all at once.
For example, when you separate Mixture A by HPLC, various peaks are detected. You can register them in the library as the mass spectra of Mixture A. Next time you analyze the same compound, it can be directly identified as Mixture A. The data on spectral changes induced by a temperature gradient can also serve as the reference data for mixture identification.
Consequent Benefits
- Different peaks can be analyzed simultaneously, and the number of unidentifiable peaks is reduced.
- You can get rid of the tedious task of finding the optimal separation conditions.
- When you try to achieve complete separation, it is impossible to analyze variable components under a single condition. With the DiscoveryM, you can conduct a rough analysis to get a quick idea about the components.(Conventionally, it was impossible to determine the optimal separation condition when an unknown compound was analyzed. Now, with the DiscoveryM, you can identify its key components, if their data already exist in the database.)
The Advantages of Using the DiscoveryM
- Just by searching the database, you can get the information about the constituents of a substance.
- The DiscoveryM is essential in the analysis of complex spectra obtained by direct mass spectrometry.
- You can determine if a given peak in a complex spectrum derives from a contaminant or a component of the sample. Hence, you can judge which peaks require further analysis.
- You can quickly perform spectral matching for the substances already analyzed in the past. Also, you can easily distinguish background noises.
- You can analyze overlapping peaks detected in the HPLC analysis without resolving them.
It takes time to separate overlapping peaks completely. It is also difficult to tell whether a certain peak actually contains different peaks. Furthermore, it is often impossible to identify the components that correspond to the overlapping peaks. However, with the DiscoveryM, you can directly analyze the overlapping peaks without separating them. - The DiscoveryM gives a great help in the identification of existing products.
- The complex constituents of a raw material can be identified.
- You can monitor how the quality of a product or a material changes as time passes, including how it deteriorates.
Applications
- Quality control of raw materials in chemical production. (You can make a comparison between different lots, stabilizers or materials.)
- You can specify the substances which cause the quality change of food or chemical products.
- The DiscoveryM can serve as a first screening tool for the selection of drugs or agrochemicals.
Examples of Applications in Different Fields
< Product Development >
Let’s say that you have developed a resin containing alight stabilizer. If you wish to know if the stabilizer is preserved in the product without being decomposed, you can check it in just a few minutes with the DiscoveryM. Then, if decomposition is observed, you can change the molding conditions or try different light stabilizers.
< Quality Control >
If the multicomponent mass spectra detected by the analysis of your products or their raw materials are recorded in the library, they can serve as reference data when raw materials are purchased for production or when you monitor product quality.
< Estimation of Changes over Time >
Analyze a product immediately after it is manufactured, and record the mass spectra of its variable constituents in the library. Then, analyze the same product after a month, or a year, and compare its mass spectra with the original ones. In this way, you can watch the changes over time.
You can further improve your quality control if the spectral changes are correlated with conventional evaluation criteria, such as the appearance and taste of the product.
Customer Comments
A Customer Involved in Food Analysis
How did you like the DiscoveryM when you saw it first hand?
- At the demonstration, I was very much impressed with the user-friendliness of this software. It covers the gamut of convenient functions.
Are there any features you are especially interested in?
- The DiscoveryM is useful not only in analyzing a single-component sample. I was amazed that the data on substances forming a mixture can be grouped together and correlated with a multicomponent spectrum observed. Moreover, data matching can be conducted based on spectral features, without being affected by the fluctuations in retention time or peak intensity.
How do you think will this software help you if you continue to use it?
- It used to be a laborious task to check if all the materials were preserved in a product. While they decreased in different proportions, we had to conduct analysis on each key component. Now, with the DiscoveryM, data matching can be quickly performed based on spectral similarity. Moreover, it allows objective estimation with the same identification basis even if the experiments are conducted by different operators. I believe this software will bring us great benefits.
A Customer Involved in Drug Analysis
Are there any features of the DiscoveryM you are especially interested in?
- The spectrum of a complex mixture can be directly subjected to a database search.
- When the databases of reference standards are created, they can be conveniently organized in a directory structure.
- The setting of the baseline threshold, as well as background subtraction, is easily achieved.
- The spectra of various substances can be grouped together and used in the analysis of mixtures.
- The product image as the expert of mixture analysis is fascinating.
- With the DiscoveryM, it is quite valuable to record not only the data on reference standards but also those on mixtures.
- Even without analyzing reference standards, you can construct a database just by entering the values manually.
How do you think will this software help you if you continue to use it?
- As the database grows, the matching accuracy enhances, and the software becomes even more useful.
- The users can determine by themselves the baseline thresholds and the values for background subtraction. Also, when they create a database of reference standards, they can define the calculation settings so that an important peak with small intensity may be easily detected. In this way, the spectral matching system can be designed specifically for each sample, and the users can quickly find the components they are looking for. In addition, as you continue to use the software, its matching efficiency improves even more.
After you started to use the DiscoveryM, did anything change? Did you find any advantage?
- We had thought that separation by HPLC was a must in a database search. However, since the DiscoveryM does not require sample separation, we can now quickly accomplish the entire analytical process. Software like the DiscoveryM is crucial especially when we perform direct analysis in real time (DART), in which complex spectra, as well as background noises, are observed in many cases. It also plays a pivotal role in analyzing the complex spectra detected by direct infusion electrospray ionization mass spectrometry.
- – As the database grew so large that the number of data exceeded 300, the DiscoveryM became even more indispensable.
- Before, it was impossible to judge if an unexpected peak derived from a contaminant from a previous experiment, a background noise, or a constituent of the sample. Now, with the DiscoveryM, we can quickly search the database and find the answer.
Pre-Installation Requirements
- Operating system: Windows XP and Windows 7 (*1)
- Memory: 512 MB or higher (*2)
- Hard disk: Free disk space of 100 MB or more (*3)
- Execution environment: Java Runtime Environment 1.6.0_24 or higher*1 We have not performed compatibility testing for Windows Vista.
*2 The amount of memory required varies depending on the size and complexity of the files.
*3 The minimum hard disk space required for the operation of the DiscoveryM. Additional space is required for data files.